This lab covers different analytical processes that are typically used within real life remote sensing projects. The tools such as image mosaic, spatial and spectral image enhancement, band ratio, and binary change detection were practiced in this lab.
Methods
Part 1: Image mosaicking
Image mosaicking is necessary when the specific area you are interested is expands throughout more than one image. It is necessary to mosaic these images together to create a seemless image of the specific area. Two types of mosaicking were practiced in this lab. First, two adjacent satellite images were opened in Erdas one the same layer. These are opened separately. Before uploading the first selected image, the Multiple tab was selected to choose the Multiple Images in Virtual Mosaic. Next, the Raster tab was selected to specify first that the background transparent option is selected, and second that the fit to frame option is selected. The image was then opened. The same steps for both the Multiple and Raster tabs were completed for the second image. Once they are both opened, the images will be slightly overlapped.
Section 1: Image mosaic with the us of Mosaic Express
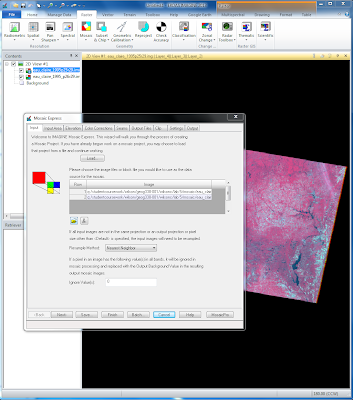
Once the images are overlapped, the Raster tab was selected. The Mosaic button was selected, followed by the Mosaic Express function. This opens the Mosaic Express window as shown
.
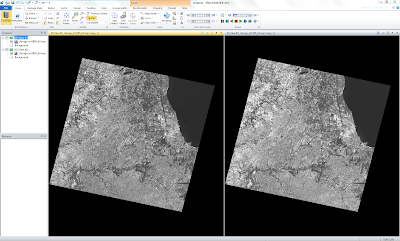
Within this window, the folder button was selected to open up the desired image. The images are selected in the order, that which ever is selected first will lay on top of the image that is selected second. From here, the final tab labeled Output was selected. Next the folder button was clicked to designate where the output image would be saved, and also to name the output image. The following image includes the original photos on the left, and the output images on the right.
Section 2: Image mosaic with the use of MosaicPro
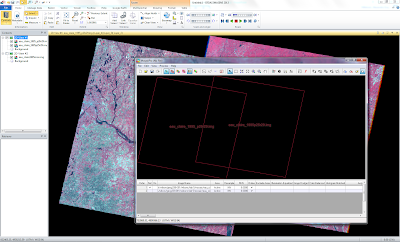
Next, Mosaic Pro was used to generate an output image that will appear more blended, with the separate image edges being harder to discern. First, the previously generated output images were opened however the same functions under the Multiple and Raster tab as before. Now, the Mosaic tab was again selected under Raster, however this time the MosaicPro function was used. The MosaicPro window was then activated. The Add Images button was then selected to open another window. Now the desired image was selected. Following this, the Image Area Options tab was selected where the Commute Active Area function was chosen. After this, clicking Okay finalized this step. These steps are then completed for the following image.
The generated output image looked as follows.
From here, the Color Corrections button was selected on the tool bar to open up it's dialog box. Here, the Use Histogram Mating button was then selected and next the Set button was clicked, which opened up the Histogram Matching window. In the first drop down box, Overlap Areas was selected. From here, Okay was selected on both windows to complete this stage. These windows appeared as follows.
Back to working in the MosaicPro window, the Process function was selected, followed by the Run Mosaic button. Next, the desired folder for the output image was selected. Here, the desired image output name was created as well. After clicking Okay, the following output image was generated.
Part 2: Band Ratioing
Band ratioing was completed in this part of the lab by using the NDVI, normalized difference vegetation index. In Erdas, the desired image was opened. The Raster tab was the selected, followed by the Unsupervised button, then the NDVI function. The Indices window appeared. Here, the current image was selected for the input file, and the desired image output name and folder location were selected for the output. The sensor Landsat 4 TM - 6 bands was selected. Under function, NDVI was chosen.
From here, Okay was selected, and the output image was generated and the outcome looks as followed.
Part 3: Spatial and spectral Image enhancement
Section 1: Spatial enhancement
In this section of the lab, spatial enhancement techniques were used. First, the desired image was opened in Erdas. From here, the Raster tab was selected. Next, the Spatial button was clicked, followed by the Convolution function. The Convolution window appeared and 5x5 Low Pass was selected under Kernal type. The desired imput image was then selected, followed by naming the output image and selecting the desired folder location.
The Ouput image that was generated is to the right of the following photo, while the original photo is to the left.
Next, with another image, the same process was completed through the Convolution function. However, for this photo 5x5 High Pass under kernel was selected. After the input and output setting have been completed as before, and the new image was generated by clicking Okay.
The Ouput image that was generated is to the right of the following photo, while the original photo is to the left.
Edge Enhancement: Using edge enhancement, the edges were enhanced to makes them more distinguishable within the image. First, a new image was opened into Erdas. Again the Convolution function was use again as above. However, 3x3 Laplacian Edge Detection was selected under Kernel. In addition, the Fill box under Handle Edges by was checked, and the Normalize the Kernel button was unchecked. Again, the input and output option were specified, and Okay was clicked to generate the output.
The Ouput image that was generated is the following photo.
Section 2: Spectral enhancement
Here, two linear contrast stretches were completed to increase the visible quality of the image. To begin, an image was brought into Erdas. By clicking the Metadata icon at the top right of the tool bar, the histogram of the image is found in the Histogram tab. Here, there was only one mode present. This allowed a minimum-maximum stretch to be completed. To run this, the Panchromatic tab was selected. From here, the General Contrast icon was selected, followed by the General Contrast function. This opens up the Contrast Adjust window. Here, in the Method window, Gaussian is selected.
After Apply was clicked, the following image was generated.
Next, another image was opened in Erdas. The histogram for this image was observed again, which consisted of several modes, mean this image had a non-Gaussian histogram. Due to this, a Piecewise stretch is used for this image. This was done so by under entering the General Contrast options, however this type Piecewise Contrast was selected. From here, the Contrast Tool window was opened. By placing the curser over the histogram, the range of each mode was determined. These values were entered into the respective "low", "middle", and "high" boxes. The last value in the "high" box was then extended to 180.
After Apply was clicked, the following Piecewise image was generated.
Histogram Equalization: This function was used to improve the contrast of the image in order to facilitate visual interpretation. To begin this process, an image was opened into Erdas. Again, the histogram was observed and found to have one mode. To increase the limited contrast in this photo, a histogram equalization was used. First, the Raster tab was opened, and the Radiometric button was clicked. From here, the Histogram Equalization function was selected which opened up it's window.
Next, the input image was designated and OK was selected.
Part 4: Binary change detection (image differencing)
Here, this function was used to find where the pixels differed between the two years, which is found through a generated difference image. First, the two desired photos to compare were opened in separate viewers. The Raster tab was selected, followed by the Functions option. From there, Two Image Functions was selected to open up the Two Input Operator's window. Here, the older image was entered into the input file, where the other older image was entered into input #2. The output file was then given a name and put into the desired folder. Within this window, the Layer option under both input #1 and #2 was changed to layer 4. After clicking okay the generated output looked as follows.
Section 1: Histogram observations
To determine the change seen, observations needed to be completed by calculation. The Metadata of this image was used, such as the Standard Deviation and the Mean, as well as the center X coordinate of the histogram. Two values of change-no change were calculated by:
1) Std. Dev x 1.5= Total + Mean = Total + Middle X coordinate= Upper Point
2) Middle X Coordinate - (Std. Dev x 1.5= Total + Mean = Total) = Lower Point
This two values were then added to the image's histogram.
Section 2: Mapping change pixels in difference image using spatial modeler
With this method, negative values will be removed from the difference image that was generated previously, to overall easily show the changes that occurred between the two selected images. To begin, and the Toolbox tab is selected. From here, Model Marker was clicked, followed by the Model Marker function. This opens a window called New Model. Here, two Raster objects were added, connected by a Function, which was then connected to an additional Raster object. The result looked as shown below.
By double clicking on each item, the desired photo was able to be input in the top two Raster Objects. From there, an equation was inserted into the Function object once again by double clicking on the image. The equation should consist of: The Oldest Image - The Earlier Image + the given constant. After this, the last Raster object was double clicked on to design an output name for the difference image, and a file location for it.
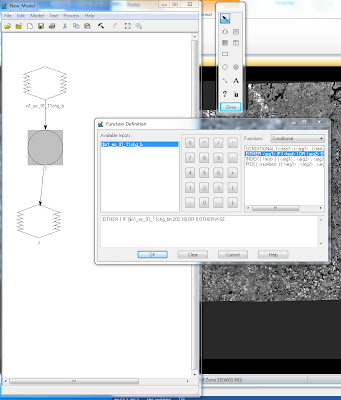
Now, this image is opened up into a view on Erdas. The same routine in Model Maker to develop a model for another output image. One Raster object is connected to one Function object, is then connected to one final Raster object. The difference image is selected to be the input for the first Raster object. In the Function object, the Function drop down box was changed to Conditional, and below this EITHER/IF was selected. An equation was entered into the lowest box, which included the photo name > the determined threshold value.
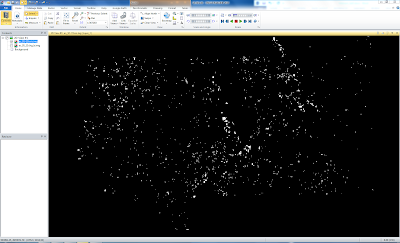
After this is all entered, the last Raster object was selected. Here the final difference output name and location was selected. The Run was run and the final output image looked as shown below.
Lastly, this image was brought into ArcMap. Here the colors of Change and No changed where designed, and the background color was removed. Furthermore, a legend, scale, and North Star symbol were added. The final generated map is shown below.
Results:
Final Outputs from the lab
Part 1: MosaicExpress
Part 2: NDVI Output:









No comments:
Post a Comment